LinkedIn personal profile metrics
This article explains the metrics available for a LinkedIn personal profile, what each one means, and the platform limitations that affect the data you see.
👀 Good to know
Follower data is available from the moment you first connect your profile to the platform, or from the moment you renew the granted permissions if your profile was already connected.
Post stats are only available for content published via the platform, due to LinkedIn’s API limitations. Historical data and external content aren’t accessible. This restriction does not apply to company pages.
📝 Note
Some LinkedIn metrics may not match the values shown in the LinkedIn interface.
The data is retrieved directly from the official LinkedIn API. According to their documentation, the metrics IMPRESSION, MEMBERS_REACHED, RESHARE, REACTION, and COMMENT are not consistent with the user interface at the moment.
You can check the official documentation here.
Community
✅ GROWTH
Followers: Total number of followers on your profile.
Posts: Number of posts published via the platform in the selected time range.
Followers: Growth during that period.
Daily followers: Number of followers gained or lost in the selected period.
Followers per post, Posts per day: average values over the selected date range.
✅ FOLLOWER BALANCE
The follower balance logs all movements in your follower count.
If a user follows you, unfollows, and follows again on different days, it will count as two followers. Deleted or restricted accounts are included.
Use this metric to measure how your community responds to your content or identify days with follower gains or losses.
New followers: Gained and lost during the selected period.
Account
✅ CONTENT VIEWED IN PERIOD
This section includes data from posts that generated visits during the selected period, regardless of when they were published.
Impressions: Number of times your posts appeared in other users’ feeds.
Reactions: Total number of quick interactions your posts received, such as “Like,” “Celebrate,” “Support,” among others.
Comments: Number of replies other users wrote on your posts.
Shares: Times other people shared your posts on their network.
Posts published in the period
Displays posts published within the selected period. The data corresponds to the accumulated performance of each post, from its publication date until yesterday. The period filter only determines which posts are included in the view, not the range of analyzed data.
✅ SUMMARY
Engagement: See section What is engagement?.
Interactions: Total number of times users commented, reacted, or shared posts.
Impressions: Total number of times posts were displayed.
💡 Impressions refer to the total number of views when the content occupies at least 50% of the screen for 300 ms or the total number of clicks on it — whichever occurs first.
Posts: Total number of posts made during the selected period.
✅ INTERACTIONS
Reactions: Total number of reactions on posts.
Comments: Total number of comments on posts.
Shares: Number of times posts were shared.
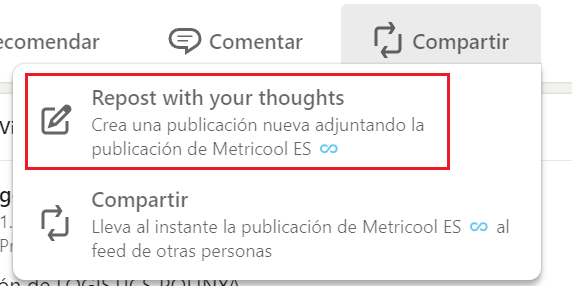
💡 LinkedIn has two types of reposts — one where you add your thoughts and one automatic repost. Only reposts with your thoughts are counted as shares.
Posts: Metrics showing the total number of posts made during the selected period.
Daily reactions, Reactions per post, Daily comments, Comments per post: Average calculated between the total value and the selected time range.
✅ POST LIST
Date: Publication date of the post.
Type: Type of post (Text, Image, Multi-image, Video, Document, Article, Poll, Celebration).
Reactions: Total number of reactions on the post.
Comments: Total number of comments on the post.
Shares: Number of times the post was shared.
Impressions: Total number of times the post was displayed.
Unique impressions: Number of unique users who viewed your post at least once. If the same person views the same post multiple times, it counts as one unique impression.
Engagement: See section What is engagement?.
Video views: Number of video views. Videos played for at least 3 seconds are counted. Auto-loop videos count as one view even if replayed.
Viewers: Number of unique people who watched the video.
Watch time: Average time the video was viewed, shown in seconds. If the video plays on loop, this metric continues to increase with each replay.
ℹ️ What is engagement?
Engagement measures how users interact with your content in relation to how visible or far-reaching it is.
In the platform, you can choose between different calculation formulas.
Note: The engagement of competitors is calculated differently from your own account. We recommend adding your own account as a competitor to make the data comparable.
Learn more here.